
Shelf-life variability of produce is a significant problem but one that many in the industry are unaware. It’s easy to assume that all pallets harvested from the same field on the same day will have the same amount of freshness or shelf-life. Unfortunately, that’s simply not true. There’s a lot of variability. A LOT.
What are the five top causes of shelf-life variability of produce? Why do some fruits and vegetables spoil before we expect them to? What can we do to manage shelf-life and reduce the variability and premature spoilage that leads to waste and lost profits?
Many people will tell you that the main causes of produce shelf-life variability occur at the grocery store. Why? Because that’s where premature spoilage becomes visible – the produce reaches a point where it’s either not salable or it has to be marked down for rapid sale. Therefore, someone at the store must have mishandled it.
But the data doesn’t bear that out.
The Data Shows What Causes Produce Shelf-life Variability
Zest Labs has gathered and evaluated extensive amounts of data, using IoT condition sensors and advanced data analytics, about what causes the shelf-life variability of fresh produce. For several years, we’ve collecting pallet-level data beginning at harvest as well as developing freshness profile data on various types of fruits and vegetables. From the data and subsequent analysis, we have identified the key factors that cause shelf-life variability and when the impacts of those factors begins. They may not be what you think!
Cause 1 – Differing Freshness Profiles based on Variety and Location
Each varietal and growing location can produce fruits and vegetables with unique “freshness profiles”. That is to say, for example, that strawberry varietal A grown in Watsonville, California will have a different profile for freshness and shelf-life capacity than varietal A grown in Yuma, Arizona. As such, it’s important to know the freshness capacity for each crop in each location. This provides a baseline for measuring the impacts on shelf-life variability of produce in the cold supply chain.
Cause 2 – Harvest Conditions and Temperature
Environmental conditions such as temperature, particularly the evening prior to harvest, can have a significant impact on freshness or shelf-life as that’s typically the temperature of the produce when it is harvested, particularly early in the morning. If it was warmer, the produce will be at a higher temperature and respirating (aging) faster when it is cut or picked. This respiration rate must be accounted for and managed as it is the key determinant of shelf-life variability of produce and premature spoilage. It’s important to note that variation occurs at the pallet level, not the truck or lot level. That is, pallets – even those on the same truck – can have different shelf-lives depending on harvest conditions.
Cause 3 – Post-harvest Handling and Processing
Based on the data we have collected and analyzed over the years, the most significant impacts on shelf-life variability of fresh produce occur in the first 24-48 hours after a produce is harvested. Specifically, the data shows, significant variations in:
Cut-to-Cool Time: As mentioned, produce is a living thing. It respirates at a rate directly tied to environmental conditions. Prior to harvest, it continues to be “fed” and “cooled” by the plant. But even though it has been cut or picked, produce continues to respirate and is now consuming its own energy sources. If left on its own, a strawberry, for example, would last about three days before spoiling. But, if that same strawberry is cooled to 34° F quickly, the respiration (aging) rate of the berry slows significantly and the berry can last 12 or 13 days.
But cut-to-cool times can vary significantly. A pallet may wait on a truck in the field for 30 minutes or three or more hours depending on labor, equipment and other factors. And the temperature in the field could be 50° or 90° – and, of course, it changes throughout the day. As a rule of thumb, for each hour of time spent at field heat, the produce will lose a day of shelf-life. Most growers believe that their produce is cooled within one-to-two hours after harvest, but we’ve documented lag times of up to nine hours. (In that case, a strawberry could go from 12 days of shelf-life to three before it is even pre-cooled!)
Once produce gets to the packing house, it may spend additional time waiting at receiving before being unloaded and there may be back-ups or bottlenecks at precooling. All the while, the freshness clock is ticking.
Precooling Efficiency: Once the produce reaches the precooler, additional shelf-life variability is introduced including the type and efficiency of the precooler, time spent in precool, and temperature of the produce. Each of these will impact the shelf-life variability based on how quickly and evenly the produce reaches its desired temperature. Our data has shown that various pallets in the same load can have different precooling experiences that result in some pallets being over-cooled and some under-cooled.
Cause 4 – Warehousing and Shipping
Warehousing and shipping conditions can also impact shelf-life variability but our data shows that, unless something egregious happens, such as power outages or the driver turning off the cooling unit on the trailer, most of the impact on shelf-life variability of the produce has already occurred.
Cause 5 – At the Store
There is some potential impact on freshness and shelf-life variability that occurs once the retailer receives the product. It could sit out on a dock at the distribution center or store or be placed on non-refrigerated displays at the store. But, for the most part, if there was significant impact on shelf-life of the produce, the damage was done further up the cold supply chain and is only manifested by spoilage at the store or with the consumer.
The Variability Challenge: You Can’t See It
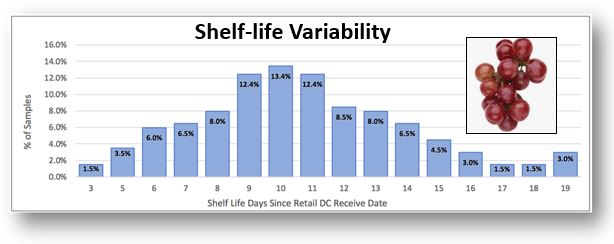
What makes this all so challenging is that you can’t see the impact on shelf-life. You can’t look at a strawberry, for example, and determine if it has 12 or six days of remaining shelf-life. As such, all pallets look the same, even though they have significant variability in remaining shelf-life. For grapes, for example and as shown in this blog’s graphic, we’ve seen as much as 16 days of variability in pallets received from a supplier to the retailer.
The point is, without data, the cold supply chain is operating blindly, and all pallets harvested from the same field on the same day are considered to be “created equal” when, in fact, they’re not.
Using Data to Manage the Shelf-life Variability of Produce
While you can’t visually see of the shelf-life variability of produce, you can measure it – and when you can measure it, you can manage it. By applying IoT sensors to each pallet of produce at harvest, collecting the condition data and utilizing advanced analytics, we can predict the impact of things like harvest conditions and post-harvest handling and dynamically calculate the actual remaining shelf-life of produce.
With Zest Fresh, we can notify workers that a pallet that has been in the field for several hours needs to be prioritized ahead of another pallet for precooling or that pallet X has only seven days of shelf-life and should be shipped locally to ensure it arrives with sufficient delivered freshness for sale and consumption whereas pallet Y has 11 days of shelf-life and can be shipped across country and still arrive with sufficient freshness for sale and consumption.
There’s another benefit as well. Because we’re identifying where shelf-life is impacted, we can then fix many of the causes and thereby minimize variability. For example, for one grower, we identified that there were bottlenecks at receiving that delayed produce from reaching the precooler and were able to help the grower fix the problem which reduced variability and improve delivered freshness.
In the end, data – and the knowledge that can be derived from it to make informed decisions – helps growers, supply chain workers and retailers to manage the impacts of shelf-life and reduce fresh food waste.
Read our white paper about shelf-life variability and learn more about Zest Fresh.
NOTE: The data in the graph reflects the received dynamic shelf-life of grapes from a single supplier at a retail distribution center. Some pallets (1.5%) had 3 days of shelf-life and some (3.0%) had 19 days of shelf-life, for example. The percentage in the bar indicates the percentage of pallets received with that amount of shelf-life. If consumers were expecting 10 days of shelf-life, roughly 38% would have a less than satisfactory experience.